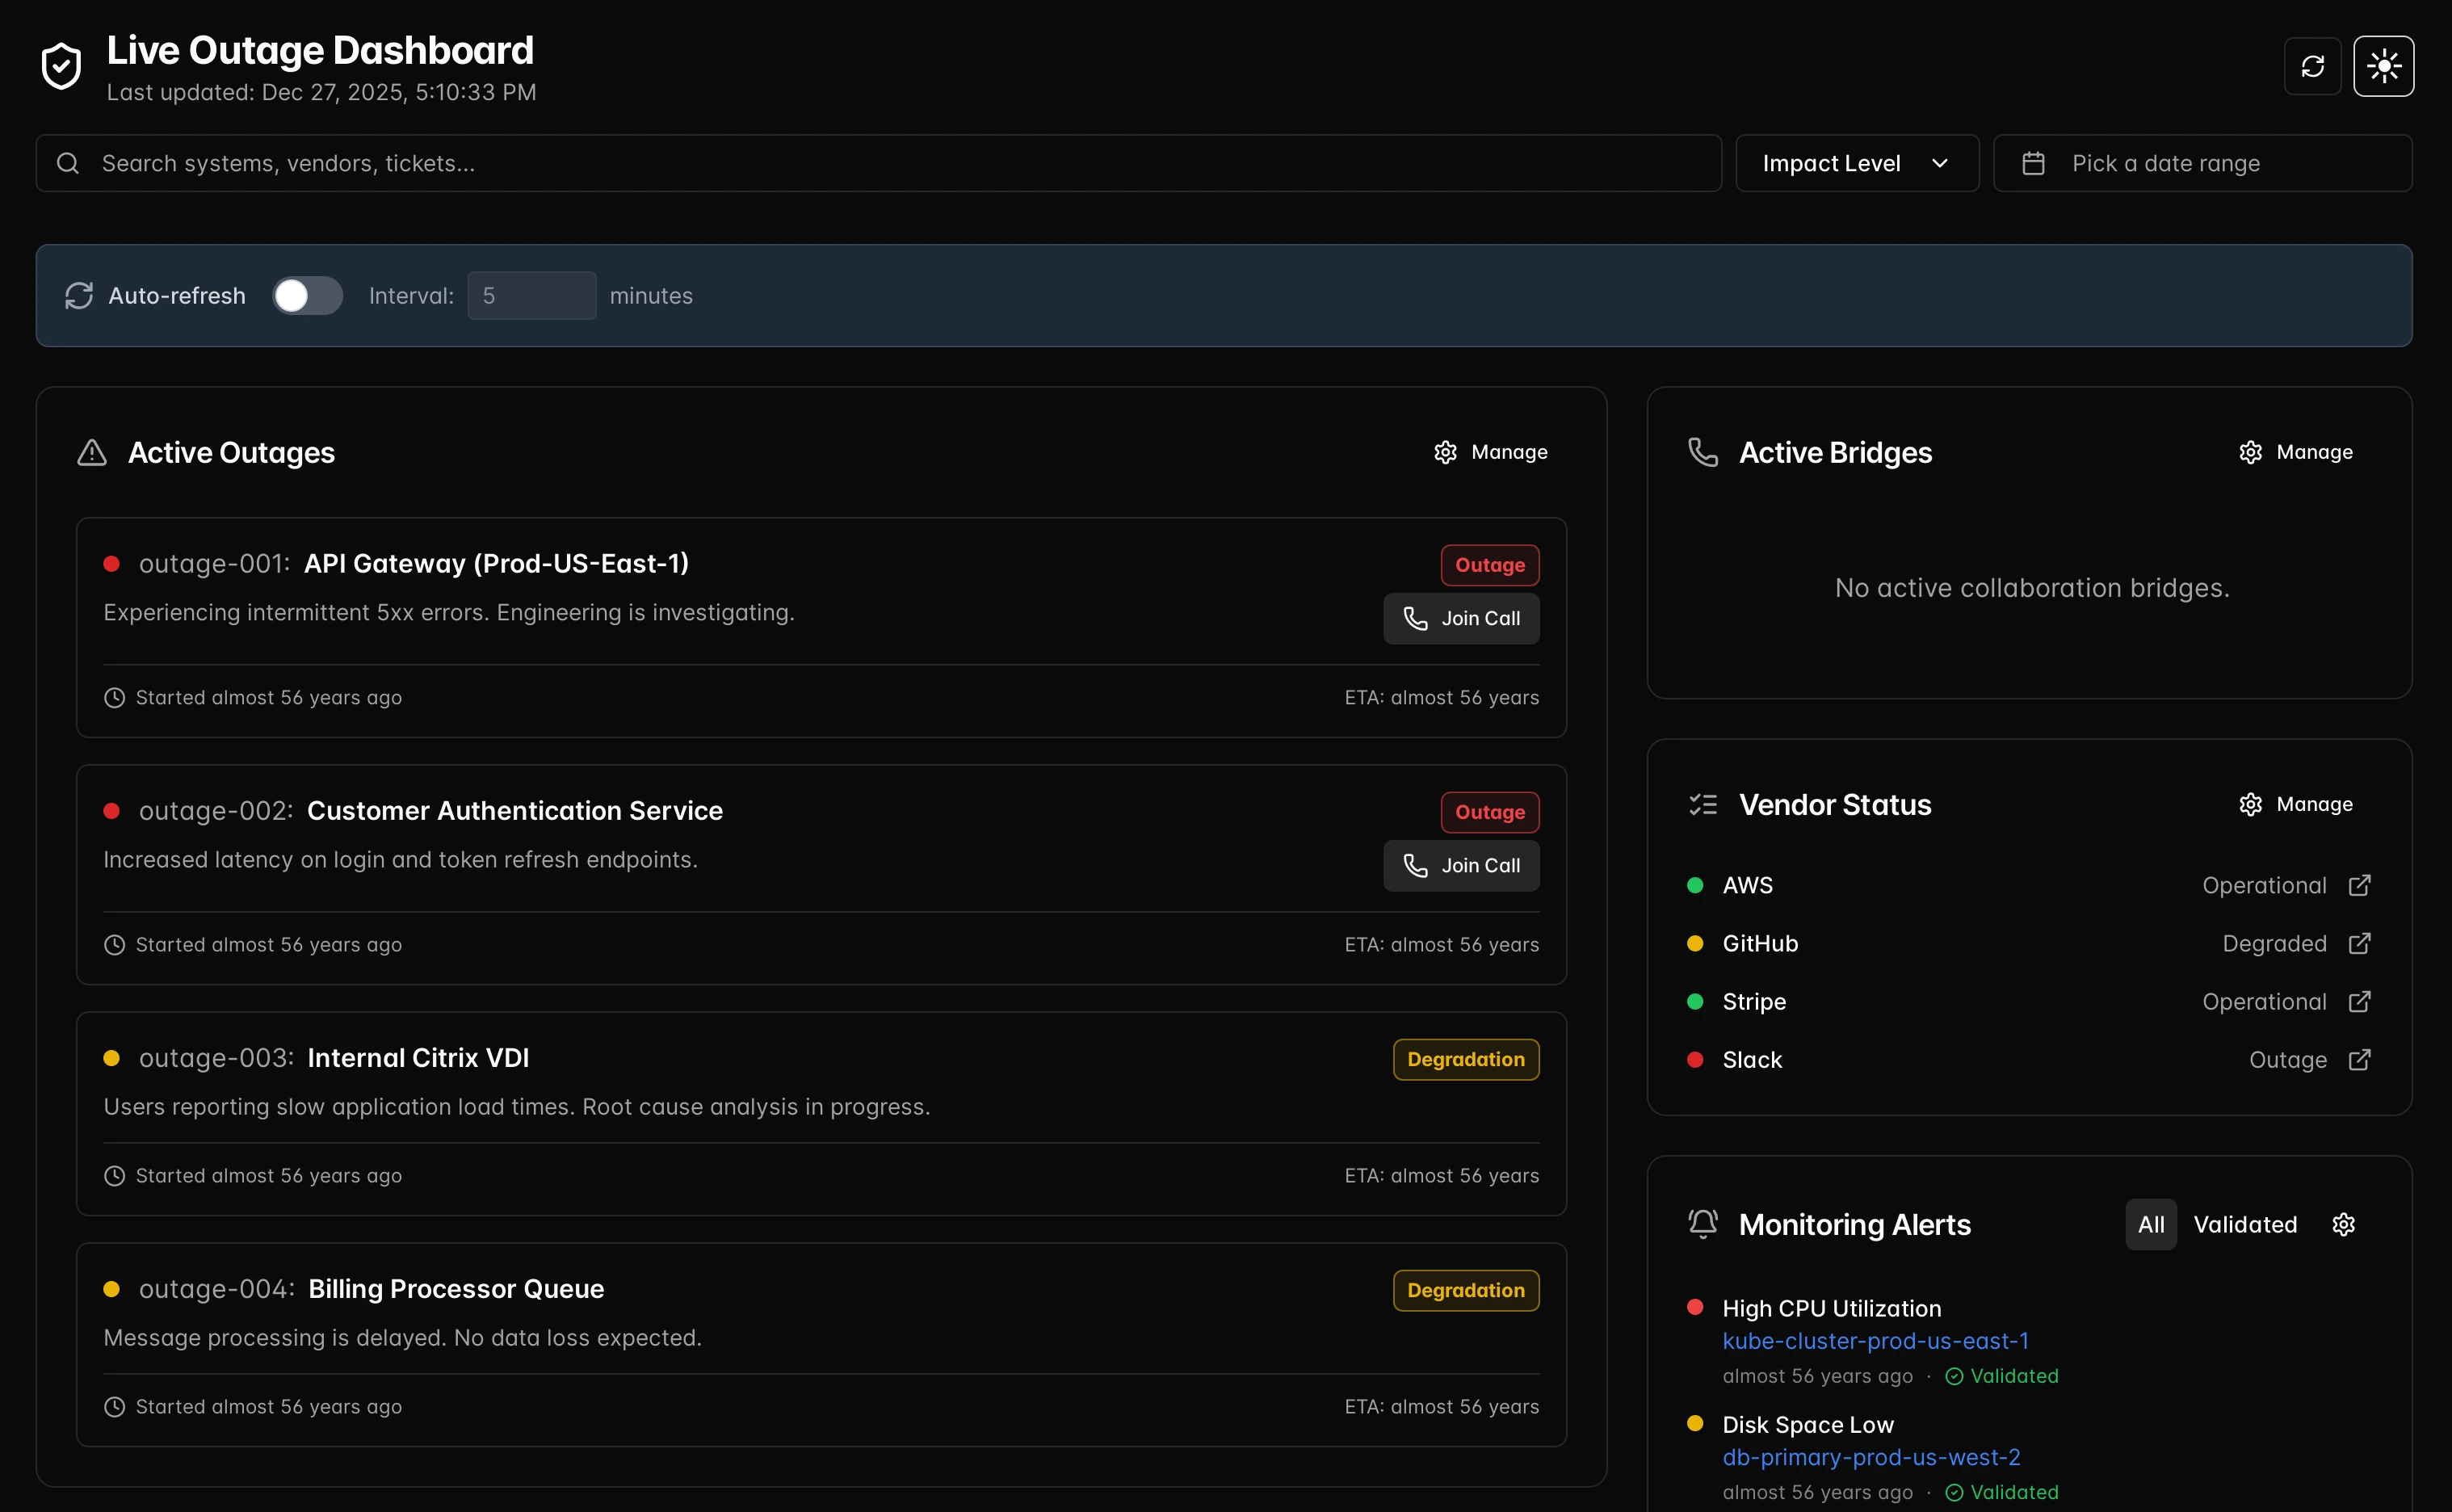
Live Outage Dashboard
A ready-to-ship status dashboard for incidents, uptime, and SLO watch. Keep teams aligned with live tiles, ownership, and comms that are always one click away.
Turn signals into status, quickly
Built for ops teams who need a crisp, shared view of incidents, ownership, and next actions.
Service tiles
Curated tiles for APIs, regions, third-parties, and maintenance windows—each mapped to the sensors and checks you already run.
- Map to HTTP and json checks
- Stack by region/provider to spot where impact lives
- Pull in change notes for context during incidents
Incident-first design
Fast labeling for degraded vs. outage, owners, and response state. Keep mitigation notes attached to the tiles that matter.
- States for investigating, mitigating, monitoring
- Ownership + handoff notes for the on-call
- Error budget + SLO guardrails on the same view
Ready-to-send comms
Publish a status page and surface updates without rewriting them. One source of truth for every channel you embed.
- Status page markup generated from the board
- Embed internally for support/leadership
- Link out to the live demo view
Built to host anywhere
Runs without a heavy backend—serve as a static app or behind your edge. Keep incident data close to your infra.
- No external dependencies for the UI
- Bring your own data sources and auth
- Optimized for edge/CDN hosting
Everything important on one screen
Pair uptime, incidents, and comms so responders see signal, status, and what to say next.
Signals
- HTTP checks, JSON, third-party status APIs
- Latency, error rate, saturation, error budget burn
- Change feed for deploys and maintenance windows
- Region-aware tiles to isolate blast radius
Communication
- Status page ready-to-publish from the board state
- Embed the live view for leadership and support
- Audit trail of updates and owner handoffs
- Note templates to keep updates consistent
How it works
Connect your monitors: HTTP checks, JSON, Solarwinds, or custom webhooks.
Group services and regions, set owners, and define what “degraded” vs “outage” means for each tile.
Publish: share the live dashboard internally or ship the status page directly.
See it in action
Open the live demo or start tailoring the board to your stack.